Qt Quick 2 Inspector
Overview
The Qt Quick 2 inspector is the tool of choice for investigating issues with a Qt Quick user interface. This includes:
- Inspecting the visual item hierarchy.
- Remote view of the rendered content with diagnostic overlays.
- Inspecting the scene graph used for rendering the user interface on the GPU or via the software renderer.
If your target has multiple QQuickView instances, the combo box at the top can be used to switch between them.
Item Tree
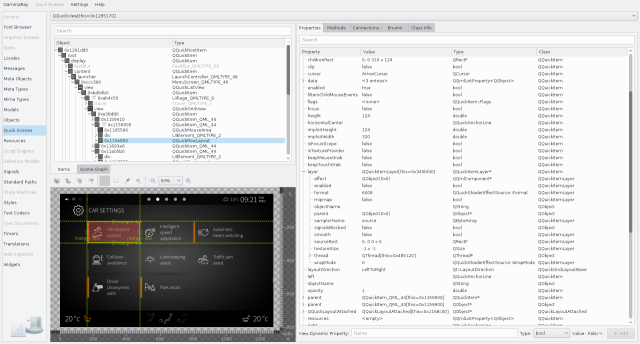
The item tree is shown on the top left, and it contains the visual hierarchy of QQuickItem instances in the currently selected Qt Quick scene. This does not necessarily match the QObject parent/child hierarchy. The right side contains universal Object Inspection view.

You can navigate to the object browser (and other applicable tools) using the context menu on the item tree. Similarly, you can navigate to the source code locations instantiating the current item, or the file declaring the type of the current item (if available).
Remote View
The remote view is shown to the lower left in the Qt Quick 2 inspector. Besides giving you a zoomable view of the rendered content, it provides a number of additional features:
- Element picking.
- Diagnostic overlays with layout information.
- Input event forwarding, for working with embedded targets.
- Color picking.
- A measurement tool.
- Taking screenshots of the target output, with or without diagnostic overlays.

The diagnostic render modes include:
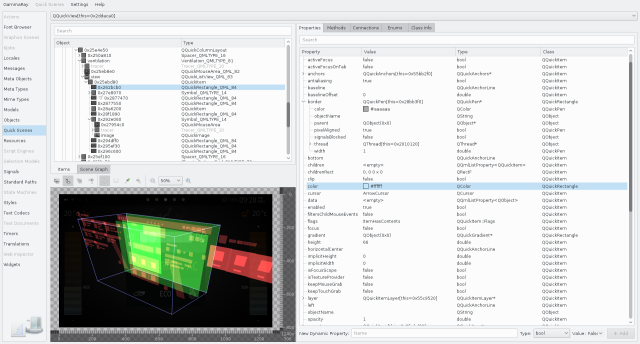
- Clipping visualization: Highlights items using clipping, which is a potentially expensive operations on the OpenGL render backend.
- Overdraw visualization: Allows to spot out-of-view elements that are drawn, as well as elements that are drawn on top of each other, both of which are potentially expensive operations.
- Batch visualization: Highlights items that are in the same render batch on the OpenGL renderer, as well as unmerged batches. Unmerged batches, and more batches in general, can have significant render performance impact with the OpenGL renderer.
- Change visualization: Highlights areas causing view updates.
- Control tracing: Highlights Qt Quick Controls 2 outlines, which can help to identify layouting issues.
- Showing a customized layouting grid.
- Slowing down the animation timer to diagnose motion design issues.
Diagnostic render modes can be enabled individually, both on the target and the GammaRay client via the Quick Scenes > Decorate Target menu option, or the corresponding remote view toolbar action.
Paint Analyzer
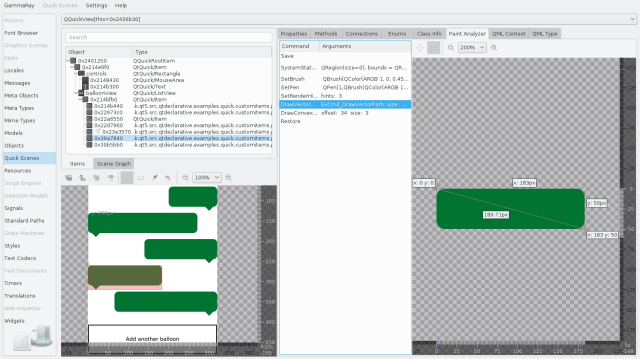
When selecting a QQuickPaintedItem sub-class in the item tree, the paint analyzer tab is activated in the property view on the right.

The Paint Analyzer allows you to inspect every single QPainter command that is executed, and look at the visual result after each step.
When using the Qt Quick software renderer, a full-scene paint analysis is also available via the Quick Scenes menu (requires Qt 5.9.3 or newer).
Scene Graph
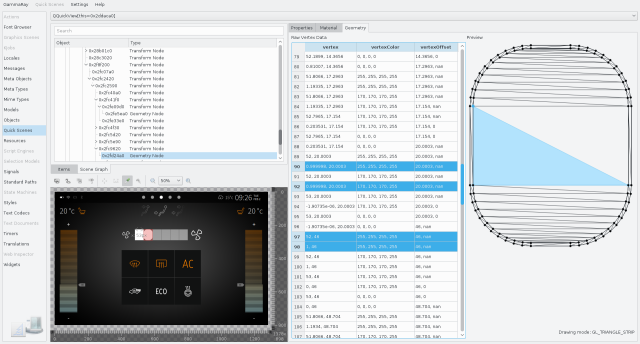
The scene graph view shows you the internal representation used by Qt Quick to render the current scene. This is particularly useful for debugging performance issues related to batching and rendering of custom QQuickItem sub-classes.

For nodes in the scene graph you have access to:
- QSGNode properties, in particularly node flags and transformation matrices.
- Shader code, if the node has a material associated with it (see Scene Graph Material).
- Geometry and other per-vertex data, when looking at a geometry node (see Scene Graph Geometry).
- Texture data for image elements, shader effects or distance-field rendered text elements (see Scene Graph Texture).
Examples
The following examples make use of the Qt Quick inspector: